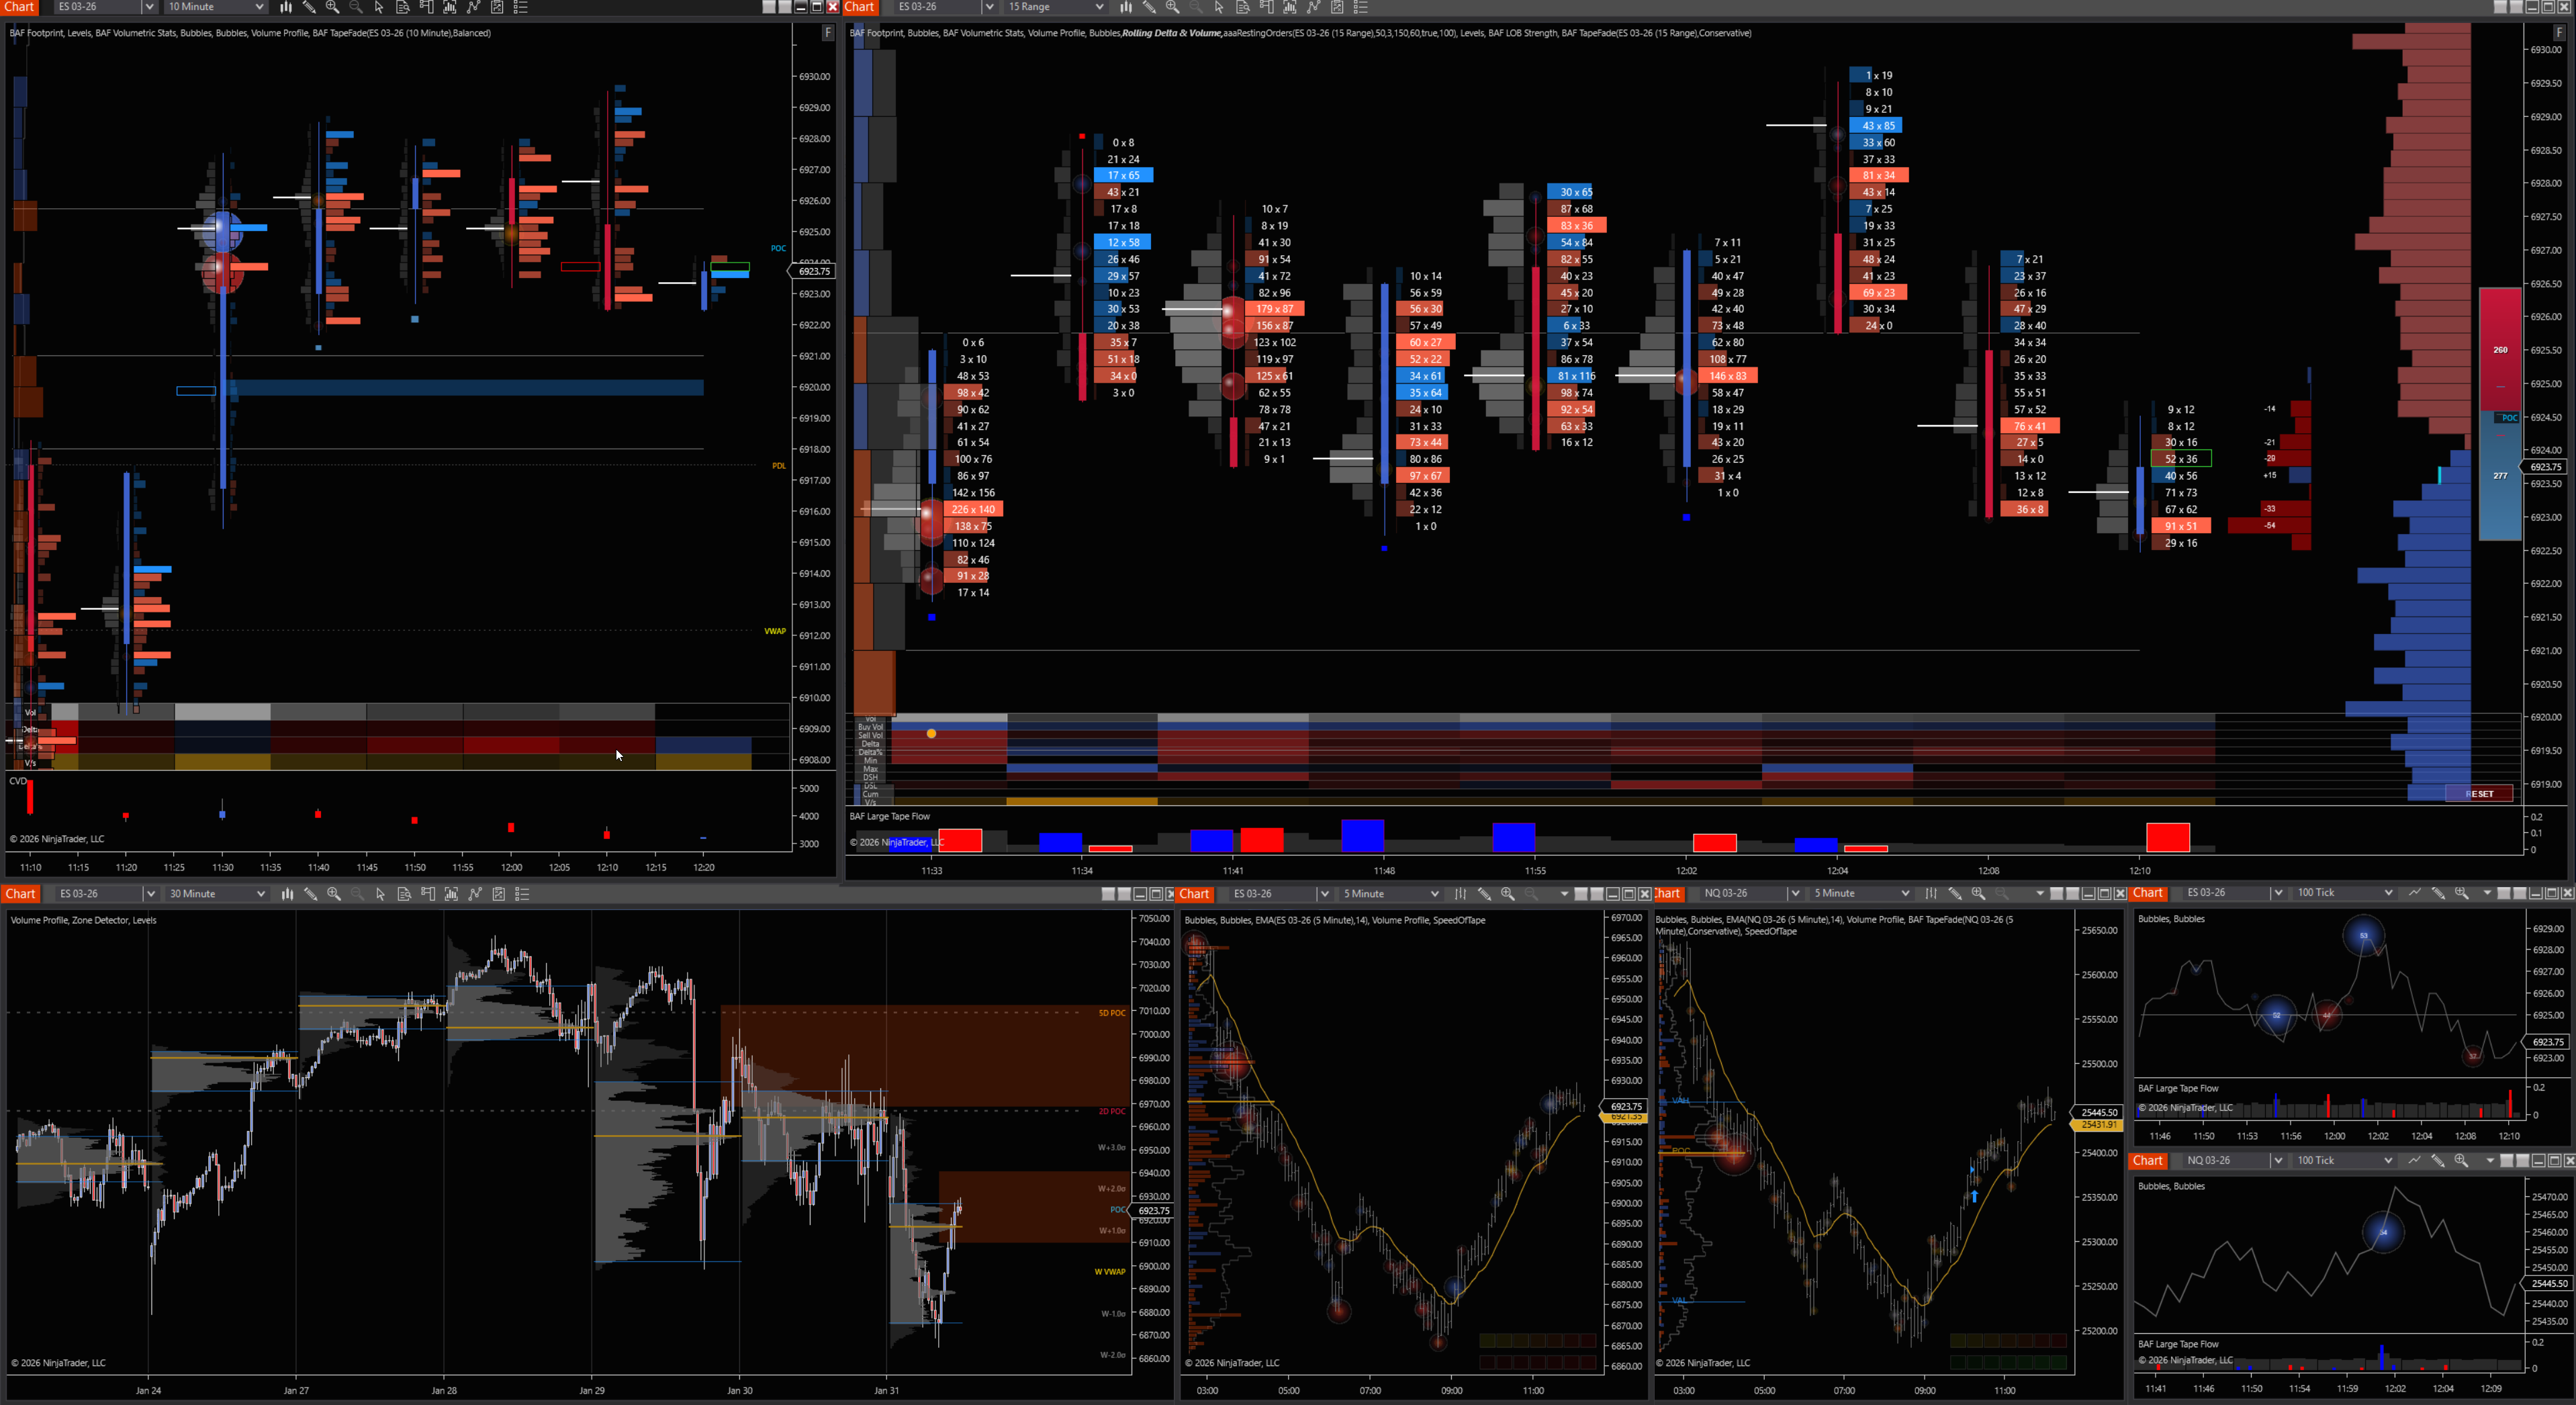
Back to Products
BAF OrderFlow Suite screenshot 1

BAF OrderFlow Suite

Complete Footprint & Delta analysis with Volume Profile integration for institutional-grade trading

$299One-time payment

Digital products are non-refundable. Please use the 14-day free trial before purchasing.

License FAQ

View full Licensing & Activation Policy →

BidAskFlow — Order Flow Suite

This suite helps you read participation (who traded), location (where), and intent (why) by combining footprint-style volume-at-price, delta, profiles, tape, and limit order book context into one workflow.

Use it to validate entries at key levels, filter chop, and manage trades with better structure around liquidity and aggression.

Quick user guide

  1. 1) Start with context: mark higher-timeframe levels, then anchor your session narrative with Rolling Profiles (RDVP) + Volume Profile.
  2. 2) Validate the level: use Enhanced Levels + Bar Statistics to decide if the level is “active” today (initiative interest) or just a reference.
  3. 3) Time entries: confirm with Footprint / Delta Bubbles + Speed of Tape + Large Tape Flow; look for absorption, imbalance, or exhaustion.
  4. 4) Manage risk: track LOB Strength + Market Depth (LOB) to see if liquidity is supporting your direction or pulling away.
  5. 5) Avoid traps: use TapeFade to recognize trapped traders and failed breakouts before you commit size.

Footprint Bars

See volume-at-price inside each bar so you can separate “movement” from actual participation.

Use it to spot absorption (heavy volume with limited progress), imbalance (aggressive control), and unfinished business at key prices.

Best used at pre-defined levels from profiles/levels so you’re not reacting to noise.

Delta Bubbles

Highlight aggressive buying/selling bursts at specific prices so you can quickly identify where initiative activity hit the book.

Use bubbles to confirm breakouts (initiative follows through) or fades (aggression stalls into resting liquidity).

Pair with Footprint to see whether bubbles occurred at the edge of value or into the middle of balance.

Enhanced Levels Suite

Create and maintain a clean map of the market: session levels, prior day references, HVN/LVN zones, and custom areas you trade.

Your goal is consistency: the same level definitions lead to repeatable execution decisions.

Combine with Tape/TapeFade to decide whether a level is holding (absorption) or breaking (initiative).

Bar Statistics (stats)

Turn each bar into actionable metrics (range, volume, delta, efficiency, rotation behavior) so you can quantify what your eyes see.

Use stats as filters: avoid low-information bars, identify expansion bars, and classify “trend vs balance” regimes.

Great for building rule-based playbooks (e.g., only trade pullbacks after a true expansion + acceptance).

Rolling Profiles (RDVP)

A rolling profile keeps your context up to date: where value is building right now and where it’s rejecting.

Use it to locate developing POC, value migration, and edges where responsive participants typically defend.

When price leaves value, it often moves faster—RDVP helps you frame those transitions early.

Market Depth (LOB)

Monitor resting liquidity on the exchange to understand where price may stall, accelerate, or get pinned. [web:6]

Use depth changes (stacking/pulling) to judge whether a move has real support or is being “manufactured.”

Combine with Speed of Tape to separate genuine demand from fleeting quotes.

Volume Profile

See volume distribution over price to identify acceptance (high volume areas) vs rejection (low volume areas). [web:3]

Use value area and POC to frame mean-reversion trades in balance and breakout continuation when value migrates.

Anchor execution: entries at profile edges tend to offer cleaner invalidation than random mid-value trades.

Speed of Tape

Measure how fast trades are printing to detect urgency (momentum) versus slow, rotational flow.

Speed helps confirm breakouts: if price pushes but tape is slow, the move may be fragile.

Use it for timing: enter on acceleration, reduce risk when the tape cools off near targets.

Large Tape Flow (Commercials)

Track outsized trade prints to identify where large participants are active and whether they’re pressing or absorbing.

Use it to confirm “real” continuation when big flow aligns with direction at the edge of value.

Be selective: one large print is not a trend—look for clusters and follow-through across levels.

TapeFade (trapped traders / Skeleton)

Focus on failed breakouts and rejection patterns to identify trapped traders and likely unwind paths.

Use it to fade extremes when aggressive traders get no follow-through and liquidity holds the level.

Pair with LOB Strength: fades work best when resting liquidity stays firm rather than pulling.

Limit Order Book Strength

Quantify whether the book is supporting price (stacking) or weakening (pulling) around your key levels.

Use strength shifts as early warnings: if support disappears, tighten risk or step aside.

Best when aligned with profile context (edge of value) and tape signals (speed/flow).

BidAskFlow — Suite mindset

Treat each tool as a lens: profiles define context, levels define locations, footprint/delta define execution evidence, and LOB/tape define intent.

Your edge comes from confluence: a trade is highest quality when multiple lenses agree at the same price zone.

Build repeatable playbooks (2–3 setups), then use these tools to grade trades instead of hunting randomness.

Practical example (one playbook)

If price returns to a profile edge (RDVP/Volume Profile), wait for footprint + delta bubbles to show absorption, confirm tape slowdown, and check LOB strength holding; then enter with an invalidation just beyond the defended level.