
BAF Delta & Volume Bubbles
Visualizing delta and volume surges with interactive bubble charts
Digital products are non-refundable. Please use the 14-day free trial before purchasing.
Delta & Volume Bubbles – See where volume *actually* traded
Bubbles plots volume clusters directly at price, so you can instantly spot high-activity zones, acceptance/rejection areas, and “important” prices without digging through numbers.
What you get
Volume at price, visualized
Bubbles appear at the exact price level where Delta/Volume concentrated, making key zones obvious.
Flexible scaling
Choose per-bar, visible-range, or all-bars scaling to match your workflow and timeframe.
Noise control
Filter small activity and adjust density to keep charts readable on fast markets.
Level lines (optional)
Mark the top volume prices over your chosen lookback so you can track revisits.
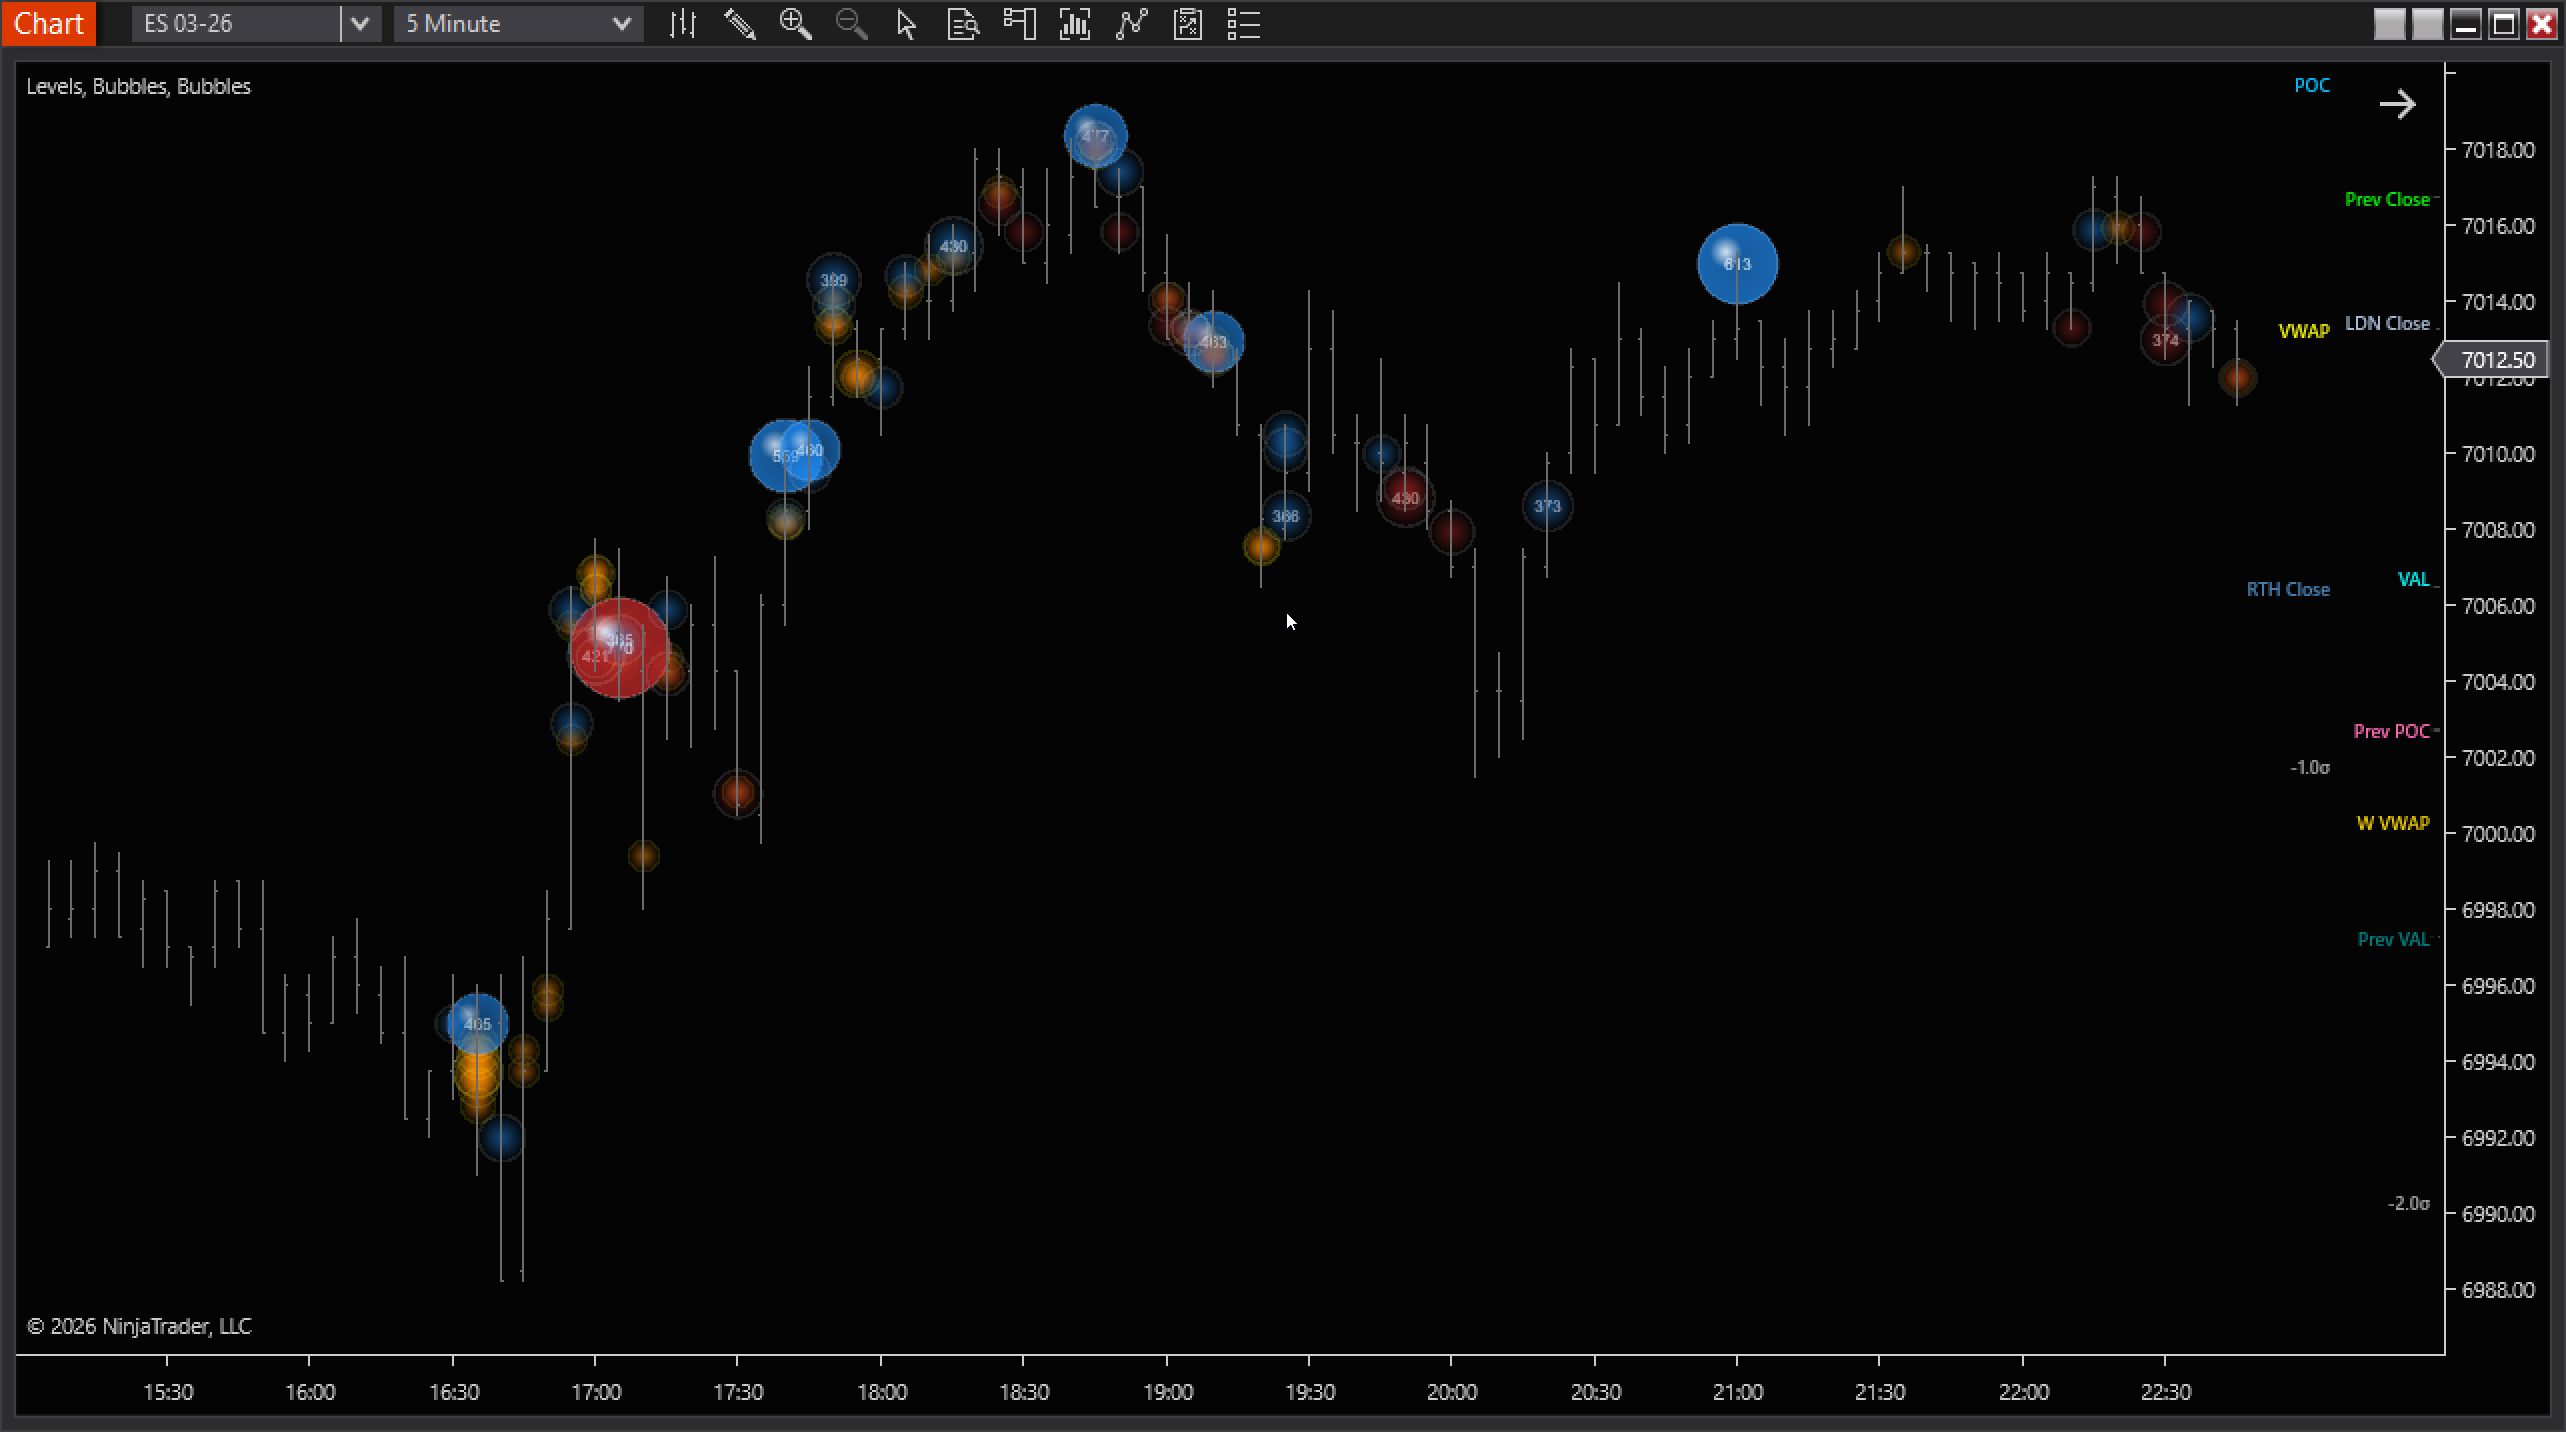
👀How to read the chart
- Size: Bigger bubble = more volume at that price.
- Color: Shows the selected view (bid/ask emphasis or total volume).
- Location: The bubble sits at the price level where volume clustered inside that bar.
- Level lines: “Most traded” prices over your lookback; useful as objective S/R references.
🚀Get started in seconds
- Add to chart: Load “BAF Delta&Volume Bubbles” on your instrument/timeframe.
- Start simple: Use a moderate Min Volume Filter to hide noise.
- Pick scaling: Visible-range is a great default for intraday context.
- Optional: Enable Level Lines to keep major volume prices visible.
⚠ Tick Replay vs Standard Mode
- Tick Replay ON: Use when you need precise per-tick delta for today or a few recent sessions. Expect heavier CPU and longer load times on many days.
- Tick Replay OFF: Recommended for loading long history (many days/weeks). Uses bar/secondary-series data for precision.
- Delta behaviour: With Tick Replay OFF, delta is approximate. Not tick-perfect tape analysis.
- Practical tip: For deep backfills and profile mapping, stay in non–Tick Replay. Turn Tick Replay on only when you specifically need tick-accurate delta for recent days.
Pro tips
🎯Use bubbles as zones
Treat big clusters as areas of interest, then confirm with your entry trigger.
🧩Combine with structure
Best results come when bubbles align with prior highs/lows, VWAP, or session levels.
🧠Declutter first
If the chart feels busy, raise Min Volume Filter or reduce Cluster Density.
⚡Heavy history
For long lookbacks or replay, reduce bubble count and keep the view focused.
Compatibility
NinjaTrader 8. Works on major futures instruments with reliable volume data. Designed for both realtime use and historical review.