
BAF Market Depth
Visualize the Limit Order Book with pulling and stacking detection right on your chart
Digital products are non-refundable. Please use the 14-day free trial before purchasing.
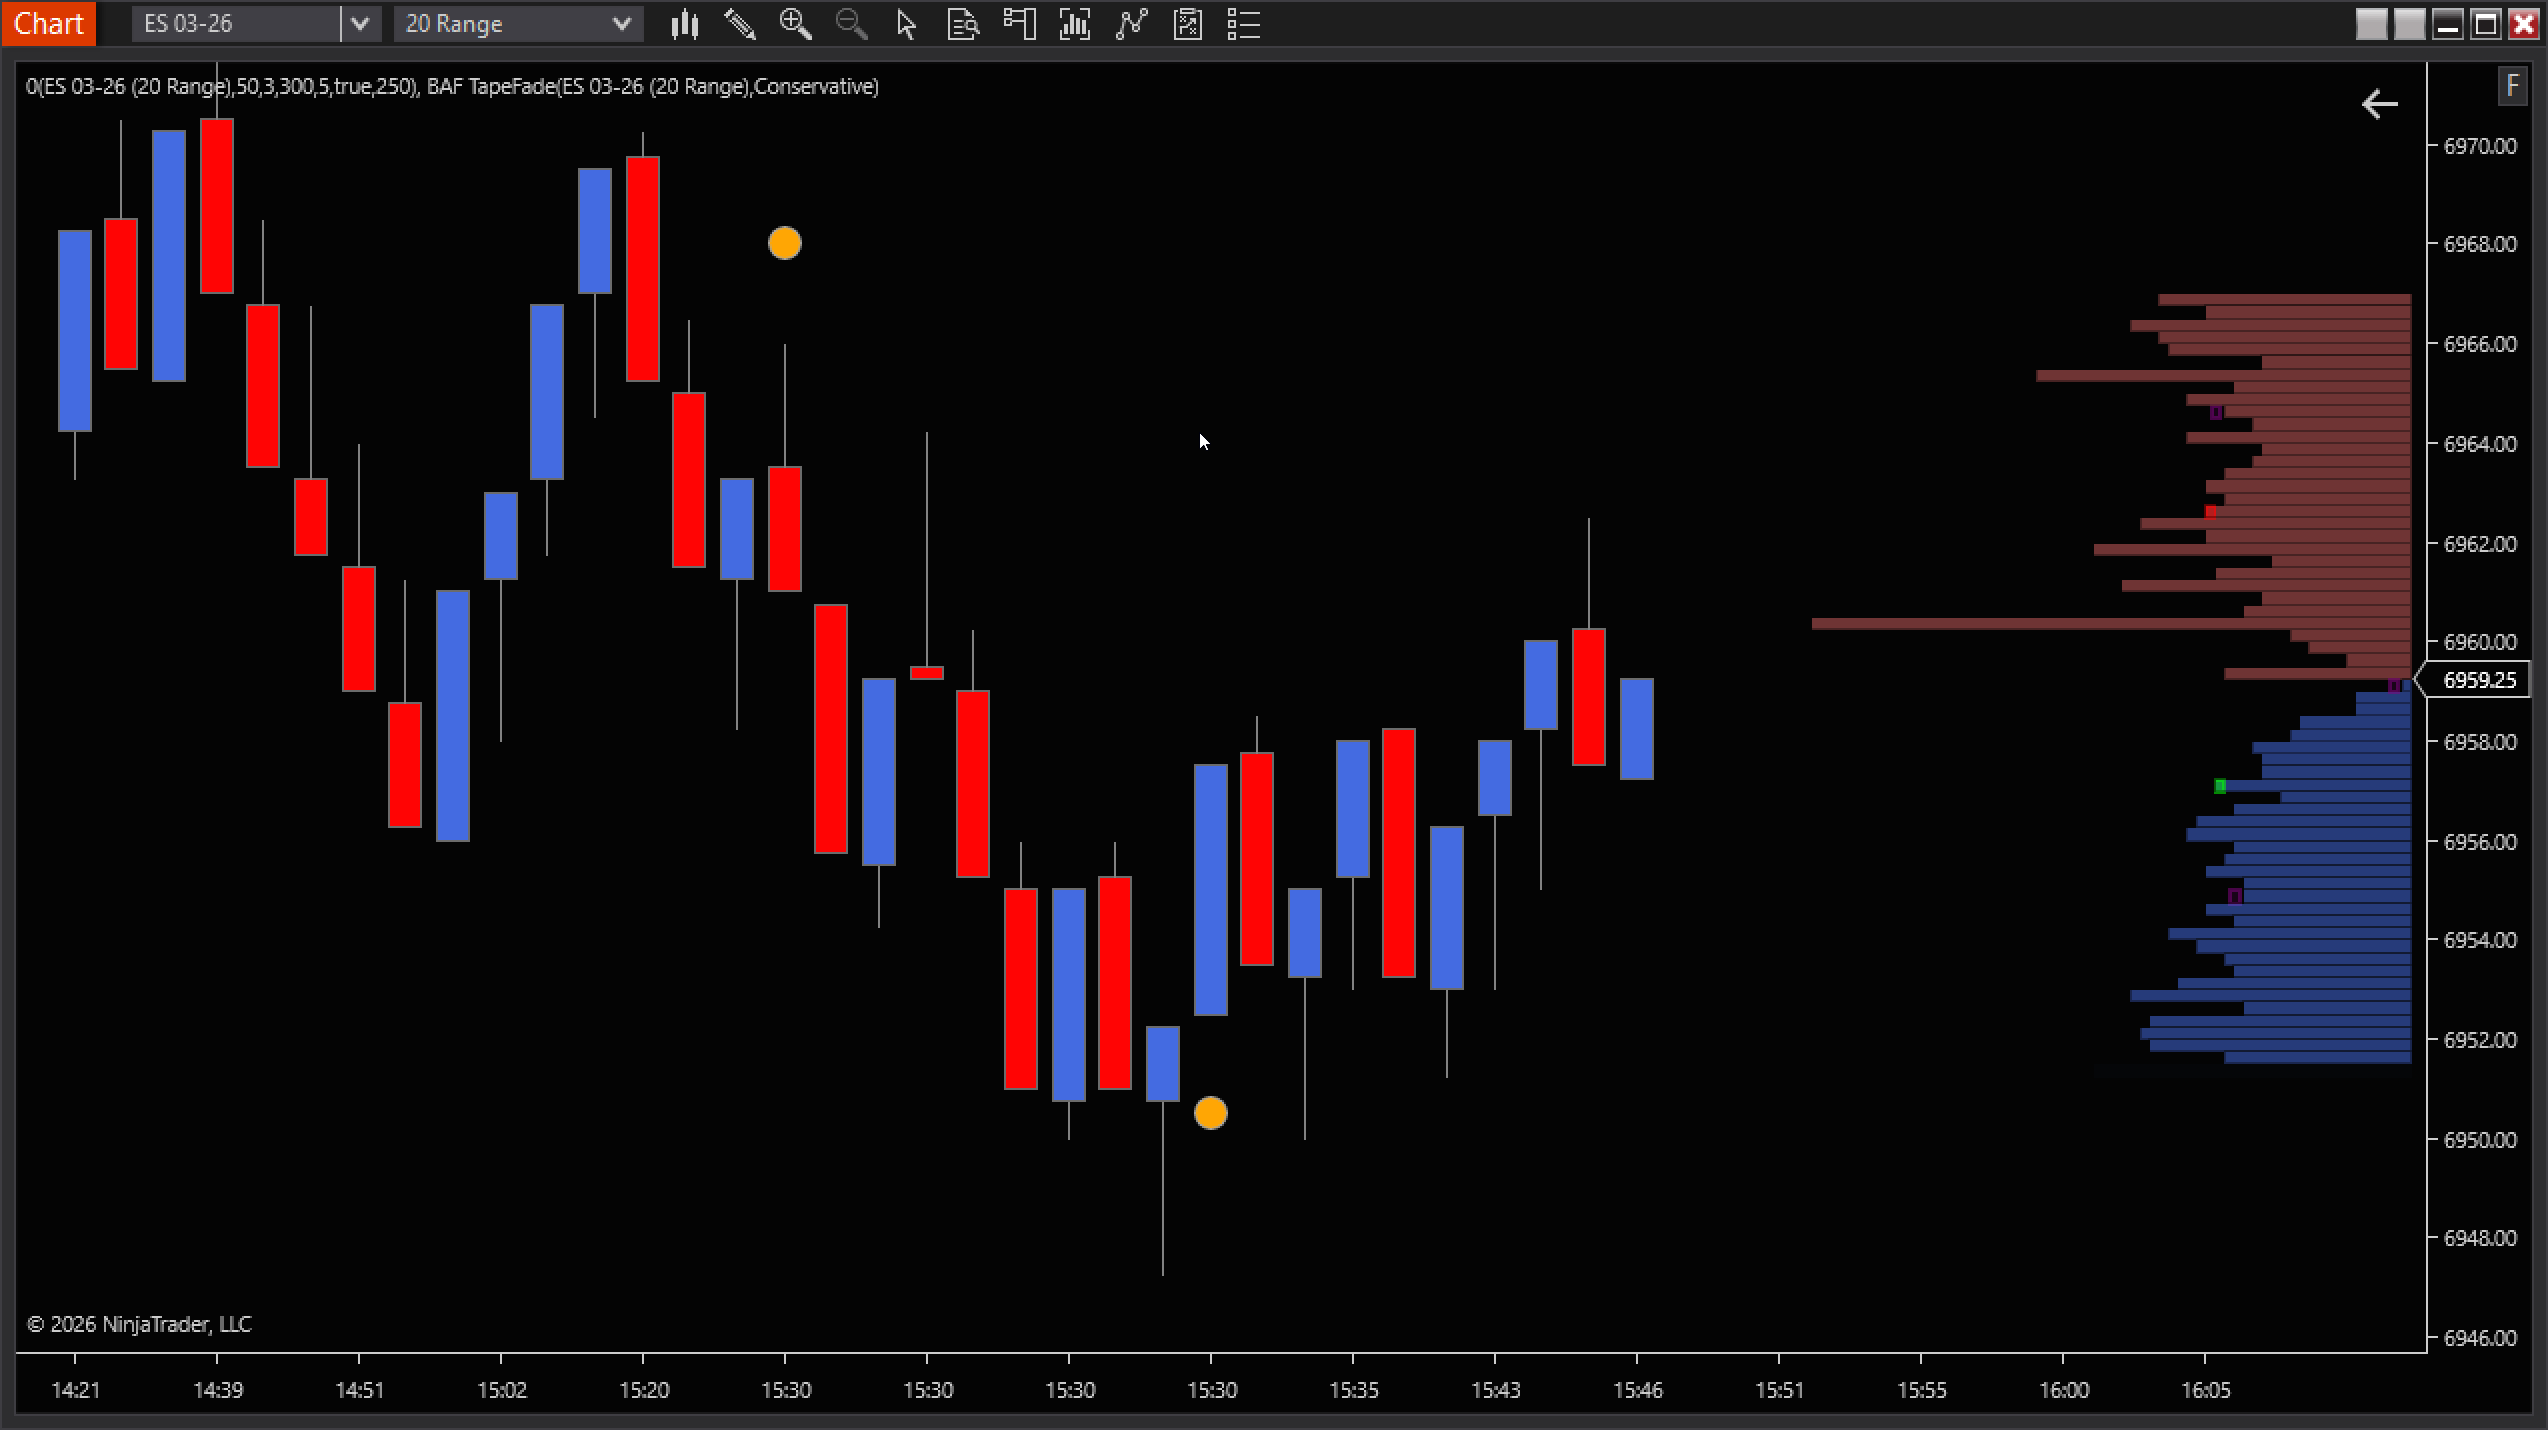
Market Depth
Visualize the limit order book directly on your chart: bids and asks rendered at price with sizing, change highlights, and fading “ghost” trails so you can track liquidity shifting in real time.
What you get
Depth at price, on-chart
Bids and asks are drawn as horizontal bars at their exact price levels, so the ladder context stays on your chart.
Added/removed emphasis
Stacking and pulling are highlighted with delta overlays, helping you see where liquidity is building or disappearing.
Balanced display + stale safety
When one side stops updating, the display avoids keeping old levels visible (and can cap both sides to match available data).
Ghost trails that fade out
When levels fall out of view (movement or balancing), they can linger briefly as fading trails so you can track what just left.
👁️How to read the chart
- Bar width = more resting volume at that price.
- Color separates bids vs asks (and can use brighter “added” colors when size increases).
- Pulling (negative delta) can render as a removed marker to the left of the main bar.
- Ghost trails show where liquidity recently disappeared from the visible set; they fade out over time.
⚙️Key settings to tune
- Update Interval (ms): how often a new snapshot is built for rendering.
- Depth Levels Each Side: how far above/below price to display (in ticks).
- Max Bar Width and Right Margin: control how much chart space the ladder uses.
- Fade Duration (s) and Show Outlines: control the trail feel and readability.
🚀Get started in seconds
- Add to chart and make sure your data feed provides live market depth for the instrument.
- Start simple: Depth Levels = 10–20, Update Interval = 200–300ms, Fade Duration = 2–4s.
- Adjust layout: increase Right Margin if labels feel cramped, reduce Max Bar Width if it dominates price action.
- Optional: enable Show Outlines for clearer separation on dense books.
⚠ Tick Replay vs Standard Mode
- Tick Replay ON: Use when you need precise per-tick delta for today or a few recent sessions. Expect heavier CPU and longer load times on many days.
- Tick Replay OFF: Recommended for loading long history (many days/weeks). Uses bar/secondary-series data for precision.
- Delta behaviour: With Tick Replay OFF, delta is approximate. Not tick-perfect tape analysis.
- Practical tip: For deep backfills and profile mapping, stay in non–Tick Replay. Turn Tick Replay on only when you specifically need tick-accurate delta for recent days.
Pro tips
🎯Anchor to best bid/ask
Watch changes near the inside market first; that’s where intent often shows up earliest.
⏱️Tune update interval
Faster snapshots feel more responsive but cost more CPU. Increase the interval if you’re running heavy chart layouts.
👻Use trails for context
Ghost trails help you see what just got left behind when price moves or the visible window rebalances.
🧠Confirm with structure
Best results come when depth changes align with prior highs/lows, session levels, or your execution trigger.
Compatibility
NinjaTrader 8 indicator that listens to live market depth updates and renders a snapshot-based ladder overlay on the price panel.